Motivation
Modern multimedia applications like audio-visual coding require a high amount of computational power and memory space, which in general does not cause problems for platforms like PCs or Laptops. However, most mobile terminals like PDAs or cellular video phones are built around embedded processors, which underlie severe restrictions concerning computing power and memory usage. Embedded processors in conjunction with hardware accelerators or SIMD extensions fulfill the arithmetic requirements of current multimedia applications, such as MPEG-4 or H.264/AVC video codecs. One of the major problems concerning performance and power consumption emerges from the huge amount of data to be transferred in these applications.
In order to reduce the overall data traffic, those parts of the code, which require a high amount of data transfer, have to be identified and optimized. Since the software of the above mentioned applications may contain up to 100.000 lines of code, tools are required, which help the designer to identify those critical parts. Several analysis tools exist, e.g. timing analysis is provided by gprof or VTune. Memory access analysis is part of the ATOMIUM tool suite. However, all these tools provide only approximate results for either timing or memory accesses. A highly accurate memory analysis can be done with a hardware (VHDL) simulator, if a VHDL model of the processor is available, but it implies long simulation times.
In order to achieve a fast and accurate solution, a specialized tool, called memtrace, has been developed at the Heinrich-Hertz-Institut. The tool uses the cycle-accurate instruction set simulator ARMulator of ARM Ltd. The ARMulator allows memtrace to provide highly accurate results in a moderate simulation time. Although the analysis results are restricted to processors of the ARM family, they cover the most used embedded processor architecture of today's market.
Memtrace: A Tool for Memory Access and Timing Analysis
The performance analysis with memtrace is carried out in three steps, the initialization, the memory access / timing analysis and the postprocessing of the results.
Initialization
During initialization memtrace extracts the names of all functions and variables of the application. During this process user variables and functions are separated from the ones of the C library, such as printf() or malloc(). This is achieved by comparing the functions and global variables of the executable (axf-file) with the ones of the user library and object files. The results are written to a file, which servers as configuration file for the following steps.
The configuration file can be edited by the user, e.g. for adding user-defined memory areas, such as the stack and heap variables, for additional analysis. Furthermore the user can define a so called "split function", which instructs memtrace to produce snapshot results, each time the "split function" is called. This can be used e.g. in video processing for generating separate profiling results for each processed frame. Additionally the user can control if the analysis results, e.g. clock cycles, of a function should include the results of a called function (accumulated) or if it should only reflect the function's own results (self). Typically auxiliary functions, e.g. C library functions or simple arithmetic functions, are accumulated to the calling functions.
Memory Access and Timing Analysis
In the second step the performance analysis is carried out. The previously generated configuration file defines the functions and variables to be analyzed. Additionally the system parameters, such as the processor and memory architecture, can be specified. Memtrace connects to the ARMulator for the simulation of the user application and writes the analysis results for the functions and variables to files. If a "split function" has been specified, these files include tables for each call of the "split function". The output files serve as a database for the third step, where user-defined data is extracted from these tables.

The Interface to the Instruction Set Simulator
Memtrace communicates with the Instruction Set Simulator ARMulator via the memtrace ARMulator extension. The extension is implemented as dynamic link library (DLL), which provides four entry functions that are called by the ARMulator. Memtrace can be retargeted to other processor platforms, if Instruction Set Simulators exist for these platforms, which provide the required tracing information about the processor state and the memory accesses.
The functions are:
- init() is called once when the ARMulator is started and initializes the memtrace profiling. It creates a list of all functions and marks the user and split functions found in the configuration file. For each function a data structure is created, which contains the function's start address and variables for collecting the analysis results. Finally two pointers, called currentFunction and evaluatedFunction, are initialized. The first pointer indicates the currently executed function and, if this function should not be evaluated, the second pointer indicates the calling function, to which the result of the current function should be added.
- nextInstruction() is called by the ARMulator each time the program counter changes. It checks, if the program execution has changed from one function to another. If so, the cycle count of the evaluatedFunction is recalculated and the call count of the currentFunction is incremented. Finally the pointers to the currentFunction and evaluatedFunction are updated. If currentFunction is a split functions, the differential results from the last call of the split functions up to the current call are printed to the result files.
- memoryAccess() is called each time a memory access occurs and increments the memory access counts of the evaluatedFunction. Depending on the information provided by the ARMulator, it is decided, if a load or store access was performed, and which bitwidth (8/16 or 32 bit) was used. Furthermore the ARMulator indicates if a cache miss occurred. Page hits and misses are calculated by comparing the address of the current with the previous memory access and incorporating the page structure of the memory.
- finish() is called by the ARMulator when the simulation has terminated. It updates the results of the last evaluatedFunction and prints the results of the last call of the split function and the accumulated results to the result file.

Postprocessing the Analyis Results
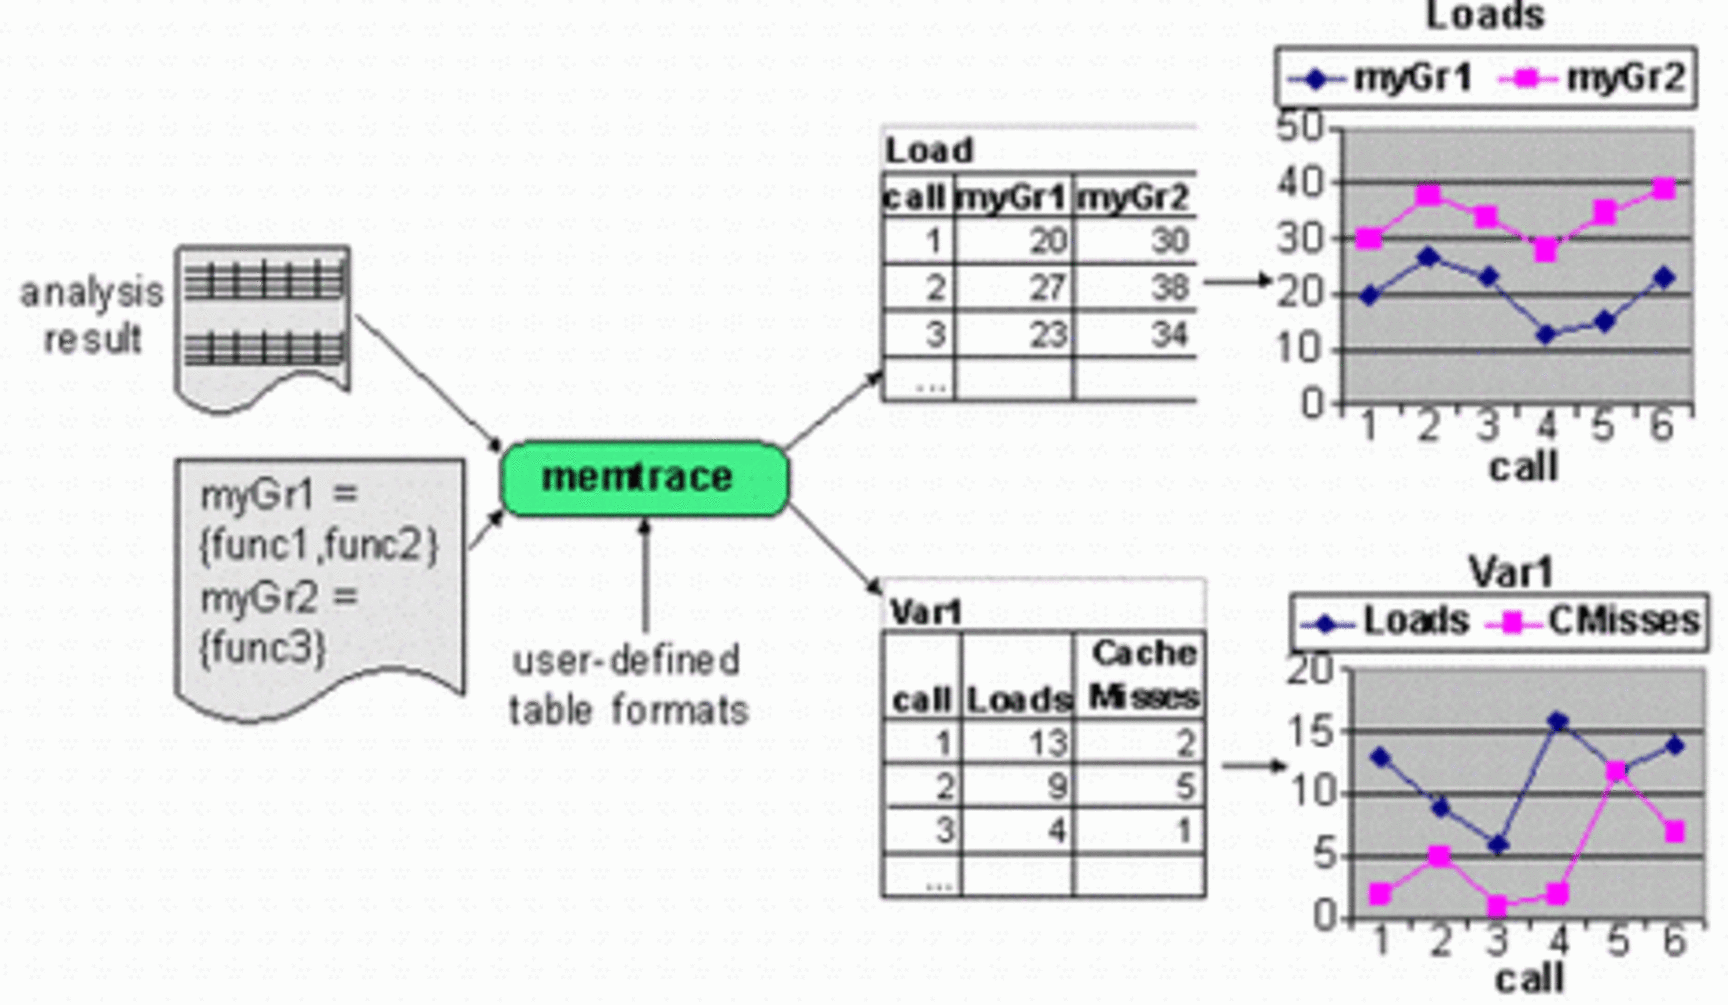
In the third step a postprocessing of the results can be performed, as depicted in Fig. 4. Memtrace allows the generation of user-defined tables, which contain specific results of the analysis, e.g. the load memory accesses for each function. Furthermore the results of several functions can be accumulated in groups for comparing the results of entire application modules. The user-defined tables are written to files in a tab-separated format. Thus they can be edited by spreadsheet programs for creating diagrams or further postprocessing.

How Detailed Profiling Supports Software Optimimization
The analysis results provided by memtrace give a detailed overview of the execution time of each function and the performed memory accesses in functions and to variable. These analysis results support the designer during the software optmization process. The following list gives some examples for how software optimization can be accomplished upon the analysis results.
- Arithmetic optimizations / SIMD instructions: The cycle count results for each function in the code allow to find the computational intensive code parts, which should be considered for arithmetic optimizations or to be executed on faster execution units.
- Combining byte to word access: The memory bus width (e.g. 32 bits) in embedded multimedia systems is often larger than the data bit width (e.g. 8 bits). For increasing the system performance, successive byte or half-word accesses should be combined to word accesses. For finding the byte-word accesses in the code, memory access analysis can be used.
- Using caches / non-cachable areas: Caches can speedup an application significantly by storing frequently accessed data or instructions. However, caches can not work efficiently, if e.g. randomly accessed large data areas, e.g. pictures in video processing, overwrite the frequently used data. Therefore, marking these data areas as non-cacheable may speedup the design. In order to find these data areas, the ratio between accesses to the data areas and the resulting cache misses needs to be evaluated.
- Using fast on-chip memory: Many embedded system architectures provide a fast but rather small internal memory (SRAM) and a slower external memory (DRAM). In order to use the internal SRAM efficiently, frequently accessed memory areas should be mapped to the SRAM. Therefore the memory accesses of the application must be analyzed, in order to find the data areas, which are most frequently accessed.
- Applying DMA strategies: Direct Memory Access (DMA) strategies can be applied for creating dynamic memory maps for fast internal memories. Data areas that are accessed frequently only at a specific time should be stored in the internal memory only during this time. The creation of such dynamic partitioning requires a dynamic analysis of the memory accesses to the data areas.
- Page miss reduction in DRAMs: The external memories of embedded systems are often dynamic RAMs (DRAMs), which are organized as pages. If a specific page is active, memory accesses to this page (page hits) are rather fast, whereas accesses to other pages (page misses) require several initialization steps which results in wait states. Therefore all data areas which need to be accessed at a specific point of time, should be placed in the same page in order to reduce the page misses.
- Speedup estimation before implementation: Optimizing the software, e.g. by using SIMD instructions, assembler inlines or general re-coding, can be very time consuming and error prone. Therefore it is helpful to estimate the speedup, which can be achieved by re-coding a specific function, and its influence on the overall performance before performing the re-coding. memtrace allows to specify a speedup factor for each function in the application. Thus the influence of optimizing a specific function on the overall performance can be estimated.
- Automatic Optimization based on analysis results: In literature many automatic software optimization techniques are presented. Many of them rely on any kind of profiling data. Such techniques could be combined with memtrace.
Most of these optimizations are well known and would have been applied by an experienced programmer already from the beginning. However, the optimization steps presented here are very dependent on the underlying system architecture. Therefore, the analysis results can be very helpful especially in the case when reusing software, which has been written for another processor architecture or without the focus on speed optimization. Thus, this optimization methodology increases the portability and reusability of source code. The following examplary optmization shows, how the profiling data has been applied for optimizing the usage of fast on-chip memories.
Case Study : SRAM/DRAM Data Partitioning
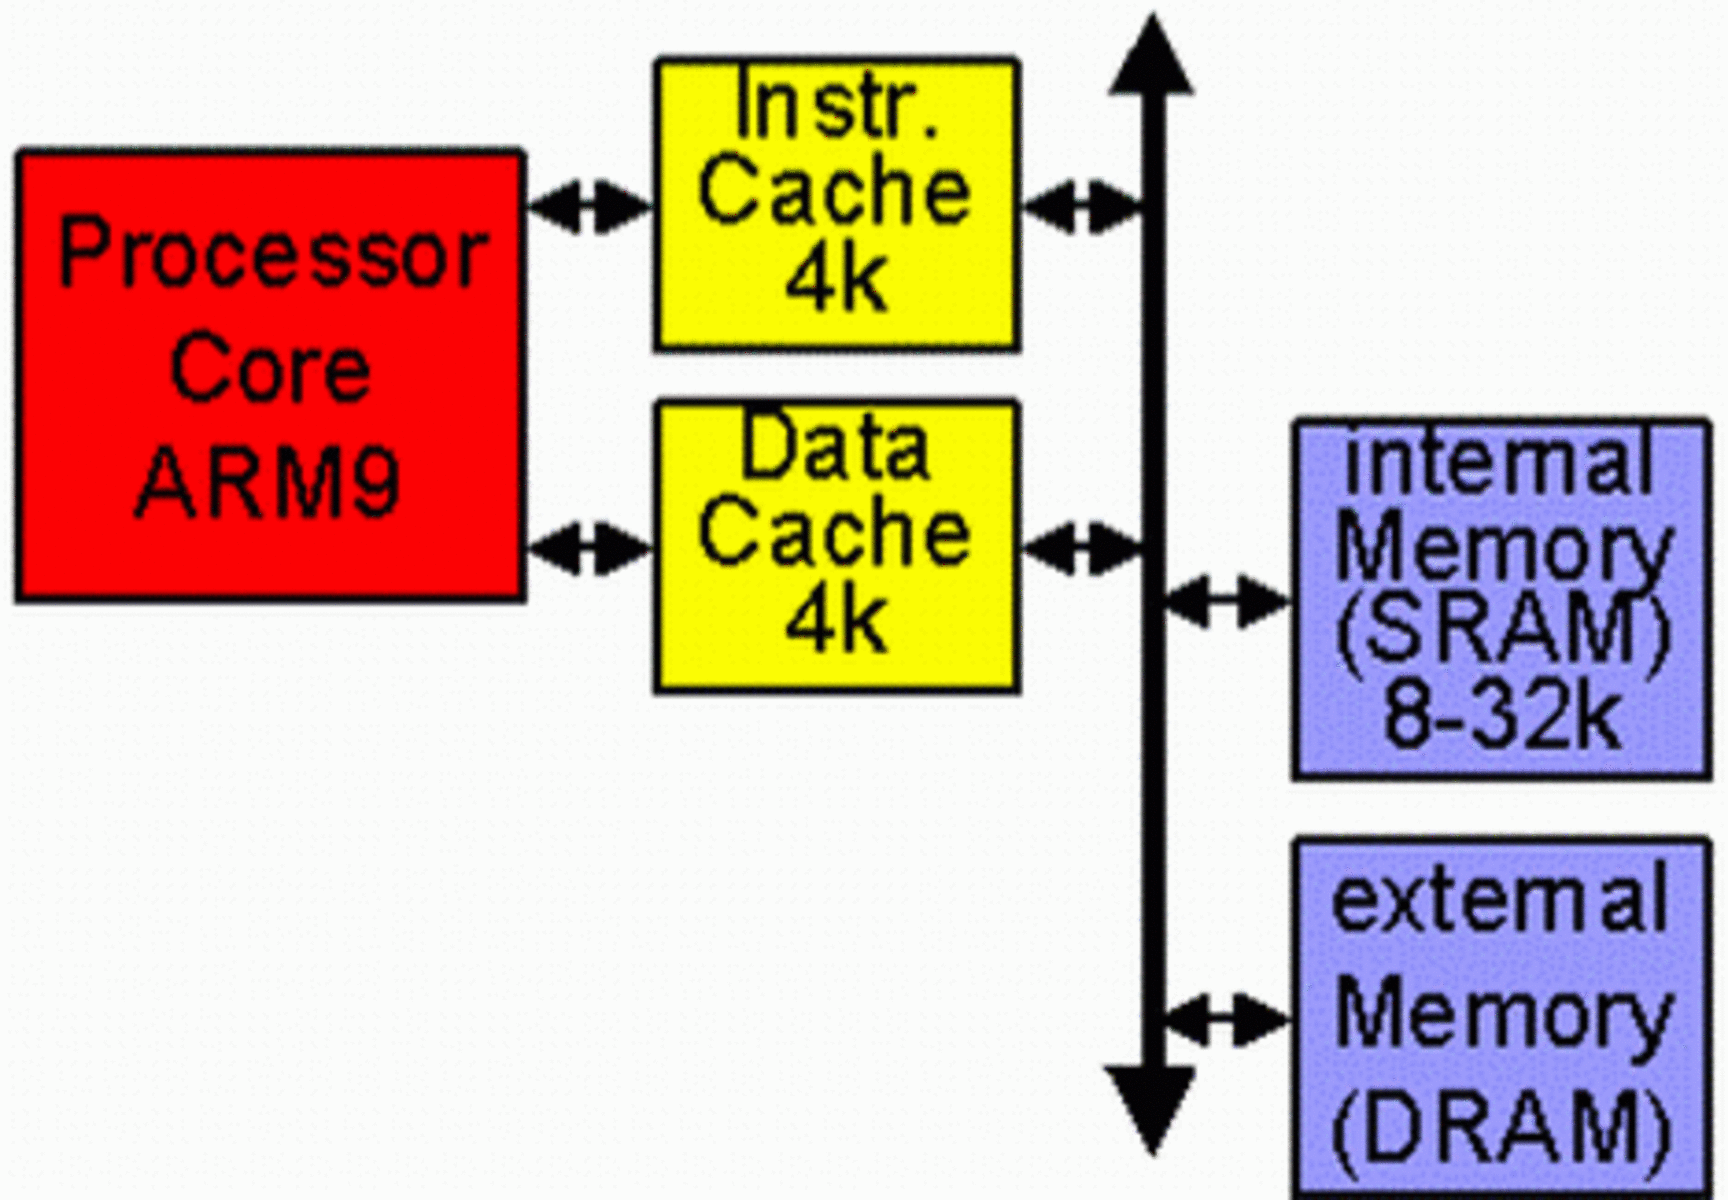
Several case studies have been carried out in order to verify the usability of the analysis results for performance optimizations. As an exemplary embedded application a software-based H.264 video decoder has been chosen. The embedded system architecture uses a processor (ARM946E-S) and a memory hierarchy, which contains an instruction and a data cache (4 kByte each), a fast internal memory (up to 32 kByte of SRAM) and a slow external memory (DRAM).

The data cache decreases the number of memory accesses, especially for accessing the stack, and the fast internal memory can be used to speed-up memory accesses to frequently accessed data, which cannot be stored efficiently in the cache, such as randomly accessed data areas. As the H.264 decoder requires about 1.1 MByte of data memory (@ CIF resolution), only small parts of the data memory (less than 3% with 32 kByte of SRAM) can be stored in the internal SRAM. Therefore, it is required to profile the memory accesses to each data area of the decoder in order to find an optimal partitioning of data areas to SRAM and DRAM. Since a data cache is used, accesses to the memory only occur if data is not available in the cache, i.e. cache misses occur. Therefore, the cache misses for each relocatable data area need to be profiled, which includes global and heap variables and the stack.
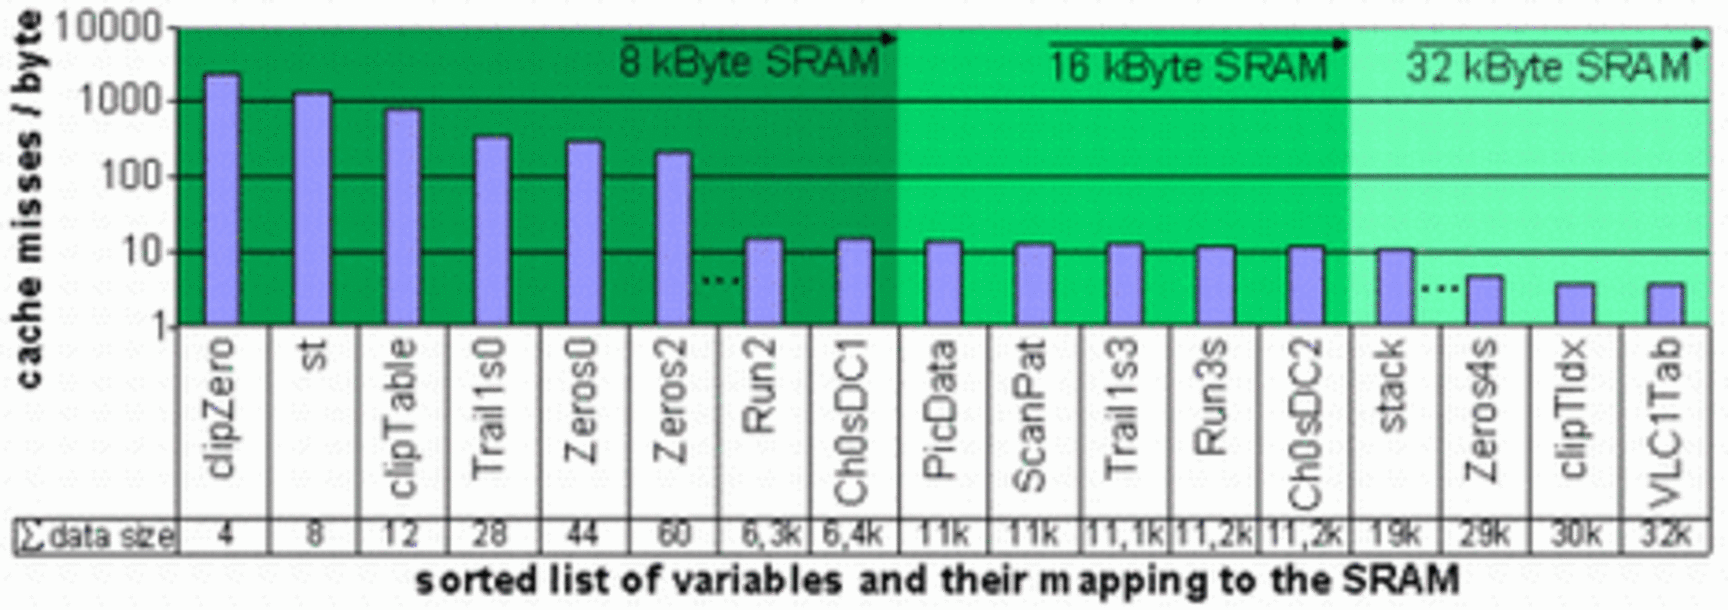
The table below shows the profiling results for these data areas. The results are presented as a ratio between the cache misses and the size (in byte) of each data area, which can be considered as cache miss density. Thus the cache miss density reflects a benefit-cost ratio between the expected performance gain due to cache miss reduction and the required SRAM size. The highest cache miss density occurs when accessing the clipping table pointers (clipZero, clipTable) and the variable length code (VLC) tables (ZerosXX, Trail1sXX, RunXX, ...).
In order to achieve the optimal partitioning, those data areas with the highest cache miss density should be stored in the SRAM. The range of data areas for 8, 16 and 32 kByte of SRAM are marked in the table. When using 32 kByte of internal SRAM with an optimal partitioning, the decoding time is reduced by more than 20%.

Heiko Hübert, Benno Stabernack, Henryk Richter, "Tool-Aided Performance Analysis and Optimization of Multimedia Applications", Second Workshop on Embedded Systems for Real-Time Multimedia (ESTIMedia 2004), Stockholm, Sweden, September 2004
Heiko Hübert, Benno Stabernack, Henryk Richter, "Tool-Aided Performance Analysis and Optimization of an H.264 Decoder for Embedded Systems", The Eighth IEEE International Symposium on Consumer Electronics (ISCE 2004), Reading, England, September 2004
Back to Memtrace Overview Page
Back to Embedded Systems Group Page